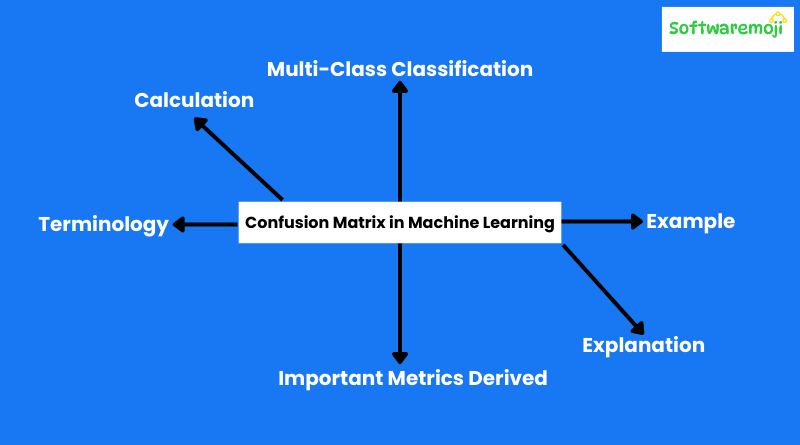
Confusion Matrix in Machine Learning:
👉What is a Confusion Matrix?
A Confusion Matrix is a key tool for evaluating the performance of classification models in machine learning. It is a table that compares the actual values with the predicted values from a classifier. By doing so, it provides a comprehensive way to understand how well the model is making predictions, especially when dealing with multiple classes.
In simple terms, the confusion matrix shows where your model is making correct predictions and where it is making mistakes.
👉Confusion Matrix Terminology: The Four Outcomes:
The confusion matrix helps to categorize the outcomes of a classification model into four key components:
- True Positive (TP): These are cases where the model correctly predicted the positive class (i.e., it predicted a “positive” outcome and it was correct).
- False Positive (FP): These are cases where the model incorrectly predicted the positive class (i.e., it predicted a “positive” outcome but it was actually negative).
- True Negative (TN): These are cases where the model correctly predicted the negative class (i.e., it predicted a “negative” outcome and it was correct).
- False Negative (FN): These are cases where the model incorrectly predicted the negative class (i.e., it predicted a “negative” outcome but it was actually positive).
👉Example of a Confusion Matrix:
Let’s take an example of a binary classification problem, where a model predicts whether a customer will purchase a product (Positive = Will Purchase, Negative = Will Not Purchase).
👉Confusion Matrix Example:
| Predicted: Yes (Positive) | Predicted: No (Negative) | |
|---|---|---|
| Actual: Yes (Positive) | TP = 50 | FN = 10 |
| Actual: No (Negative) | FP = 5 | TN = 35 |
In this example:
- True Positive (TP) = 50 (Correctly predicted positive outcomes)
- False Positive (FP) = 5 (Incorrectly predicted positives)
- True Negative (TN) = 35 (Correctly predicted negative outcomes)
- False Negative (FN) = 10 (Incorrectly predicted negatives)
👉How to Calculate a Confusion Matrix:
The calculation of a confusion matrix is straightforward:
- Step 1: Test your dataset with known outcomes (actual class labels).
- Step 2: Use the classification model to predict the outcomes for the test data.
- Step 3: Compare the predicted outcomes with the actual outcomes to determine TP, FP, TN, and FN.
Once you have these values, they are placed in the confusion matrix as shown above.
👉Important Metrics Derived from a Confusion Matrix:
The confusion matrix not only shows the counts of true positives, false positives, true negatives, and false negatives but also allows us to derive several important metrics used for classification performance evaluation:
- Accuracy: This metric measures how often the model makes correct predictions. Accuracy=TP+TNTP+FP+TN+FN\text{Accuracy} = \frac{TP + TN}{TP + FP + TN + FN}Accuracy=TP+FP+TN+FNTP+TN
- Precision: Precision tells us how many of the predicted positive instances are actually positive. It’s crucial when the cost of false positives is high. Precision=TPTP+FP\text{Precision} = \frac{TP}{TP + FP}Precision=TP+FPTP
- Recall (Sensitivity): Recall measures how well the model captures actual positive instances. It’s essential when false negatives are costly. Recall=TPTP+FN\text{Recall} = \frac{TP}{TP + FN}Recall=TP+FNTP
- F1 Score: The F1 score is the harmonic mean of precision and recall, providing a balanced measure when there is an uneven class distribution. F1=2×Precision×RecallPrecision+RecallF1 = 2 \times \frac{\text{Precision} \times \text{Recall}}{\text{Precision} + \text{Recall}}F1=2×Precision+RecallPrecision×Recall
- Specificity (True Negative Rate): Specificity tells us how well the model predicts the negative class. Specificity=TNTN+FP\text{Specificity} = \frac{TN}{TN + FP}Specificity=TN+FPTN
- AUC-ROC Curve: The AUC (Area Under the Curve) and ROC (Receiver Operating Characteristic) curve help visualize the performance of a classification model across different thresholds. It’s used to evaluate the model’s ability to distinguish between classes.
👉Why Do You Need a Confusion Matrix?
A confusion matrix is a powerful tool because it provides more insight into the performance of your machine learning model than just accuracy. Here’s why you need to use it:
- Identifying Model Errors: The confusion matrix helps you identify which types of errors your model is making—whether it’s misclassifying positive values as negatives (False Negatives) or negative values as positives (False Positives).
- Improves Model Evaluation: Relying solely on accuracy can be misleading, especially when dealing with imbalanced datasets. For instance, in a dataset where 95% of the samples belong to one class, a model that always predicts the majority class will have high accuracy but perform poorly on the minority class. The confusion matrix provides a more detailed view.
- Guiding Model Improvements: By understanding the specific mistakes your model is making, you can take steps to improve it. For example, if the model has many False Positives, you might need to adjust the decision threshold.
👉Confusion Matrix in Multi-Class Classification:
While the examples above are for binary classification (two classes), confusion matrices can also be extended to multi-class classification problems. The matrix will then contain rows and columns for each class, showing how instances of each class are predicted across the other classes.
👉Conclusion:-
The confusion matrix is an essential tool for evaluating classification models in machine learning. By providing detailed insights into the types of errors made by a classifier, it helps improve model performance and guide the optimization process. Whether you’re working with binary or multi-class classification tasks, using a confusion matrix will ensure you fully understand the effectiveness of your model.
This version is optimized for by focusing on the core concepts, including relevant keywords like “confusion matrix,” “machine learning,” “classification,” “precision,” “recall,” and other key terms. It provides a clear and concise explanation with examples to help users understand the confusion matrix and its importance in machine learning.
